
With the launch of Planifi’s Project Visualizer upon us, it’s time to step back and understand how this will change the way AE firms run. In our world of fast innovation and ever-shifting deadlines, Project Visualizer provides an unprecedented level of visibility into core aspects of your AE business.
Running an AE firm is complex, tracking people and profits across numerous projects at any given time. Project Visualizer takes away the headache and complexity of tracking these processes, creating project intelligence in an easy-to-view format.
Project planning and scheduling are streamlined into simple, efficient graphs that allow for tracking of key metrics, phases, and milestones. Hover over jobs and projects to display key metrics such as due dates, progress and remaining work. You can drill down into an even more detailed view and customization allows users to adjust settings to their own liking.
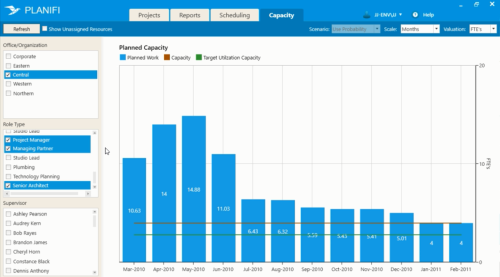
Planifi Project Visualizer Capacity View
In addition, Project Visualizer offers firms unparalleled visibility into resources and capacity. You can view project activities by enterprise, office, or individual employee. View assigned/unassigned work by individual employee and use weekly views for detailed analysis. Now, with project intelligence, AE firms can use data to optimize and grow their business.
While specific graphs and detailed analytics are always helpful, the greatest advantage Project Visualizer offers is relief. Tracking data and key metrics is a pain and poor organization impedes businesses from using this data effectively. Project Visualizer does all of this work for you, tracking scheduling plans and performance across your entire organization. This frees up time, reduces stress, and gives the arduous parts of business a refreshing new place.
Contact sales to learn more today!